Download to read offline

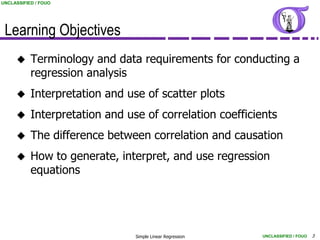
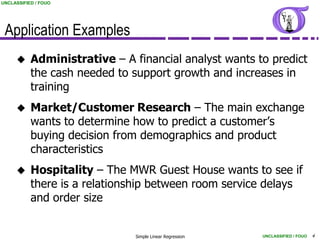
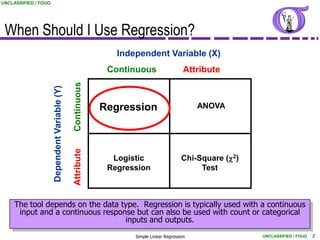
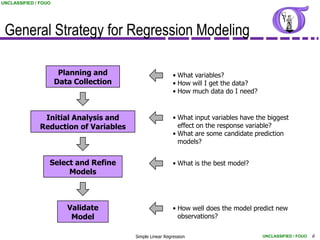
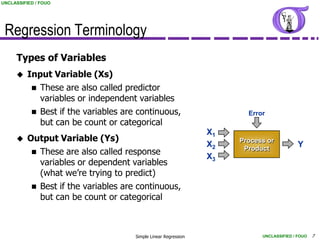
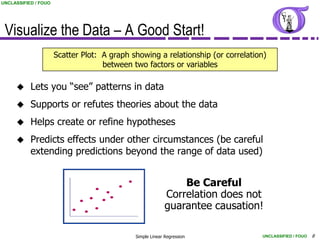
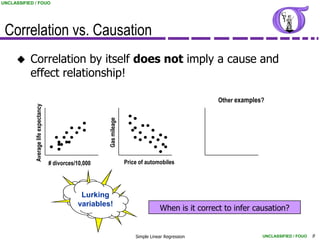
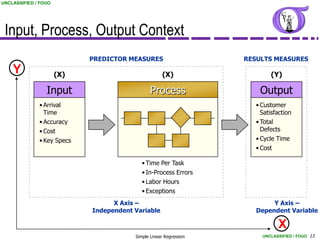
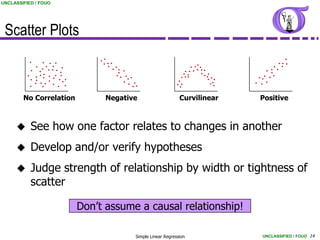
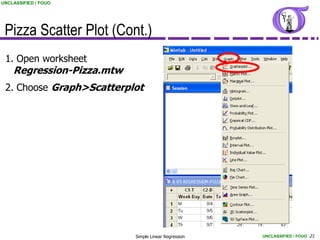
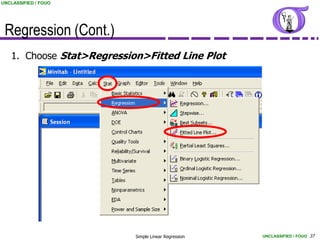
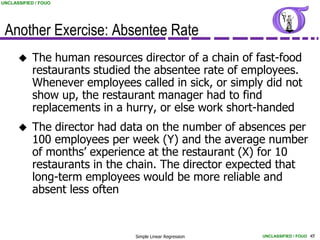
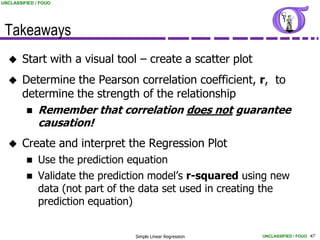

This document provides an overview of simple linear regression modeling. It defines key regression terminology like independent and dependent variables. It explains how to visualize relationships between variables using scatter plots and how to calculate correlation coefficients. While correlation does not necessarily imply causation, regression can be used to generate prediction models. The document reviews best practices like planning data collection and model validation. It provides examples of applying regression in administrative, market research, and hospitality contexts.


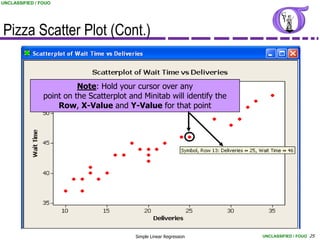
![NG BB 53 Process Control [Compatibility Mode]](https://cdn.slidesharecdn.com/ss_thumbnails/6906860-thumbnail.jpg?width=640&height=640&fit=bounds)


